Back of the Envelope Calculation: A Step-by-Step Method
A back of the envelope calculation is a quick estimate built from simple, stated assumptions, accurate enough to decide what to do next. It will not give you a precise answer. It gives you the order of magnitude in minutes, which is usually all an early decision needs, and it makes your assumptions visible so others can challenge them.
When to use one
- Is a proposed initiative worth a month of work?
- Is a number in a report plausible?
- How big is the market a colleague is excited about?
- Roughly how many hours would a process change give back?
Waiting for a full model to answer these questions wastes time. A rough estimate tells you whether to stop, continue or dig deeper.
The six-step method
- State the quantity. Include unit and period. "Annual number of delivery orders in this city" is better than "delivery volume".
- Pick a decomposition. Write the quantity as a product or sum of simpler pieces, such as households times the share that order times orders per year.
- Assign values. For each piece, use a known fact, a quick search or an informed guess. Write the reasoning beside each number.
- Compute with round numbers. Keep at most two significant digits.
- Cross-check. Estimate the same quantity a second way and compare.
- Report a range. Give a low, a likely and a high case, and say which assumption moves the result most.
Worked example: a neighborhood meal service
All numbers are invented for illustration. The question: roughly how many orders per year could a new meal service expect in a mid-sized city?
| Step | Assumption | Value |
|---|---|---|
| Households in the city | Rounded from a quick lookup | 200,000 |
| Share inside the delivery area | About one quarter | 25% |
| Share interested in the service | A cautious guess | 10% |
| Orders per interested household per year | About one a week, with gaps | 30 |
Multiply: 200,000 × 25% × 10% × 30 = 150,000 orders per year.
Now the useful part. If someone thinks the answer should be ten times bigger, you can ask which row they disagree with. Maybe interest is 30%, not 10%. The conversation is about a specific assumption, not about whose number feels right.
Range, not a point
Run it three ways by changing the shakiest rows.
| Case | Interest | Orders per year | Result |
|---|---|---|---|
| Low | 5% | 20 | 50,000 |
| Likely | 10% | 30 | 150,000 |
| High | 15% | 40 | 300,000 |
The answer is "somewhere between 50,000 and 300,000, most likely about 150,000, and the biggest swing factor is how many households are interested". That sentence is more honest and more useful than a single figure.
Top-down versus bottom-up
Use both approaches when the decision matters.
| Approach | How it works | Strength | Weakness |
|---|---|---|---|
| Top-down | Start from a large total and apply shares to narrow it down | Fast and anchored in known totals | Shares are often guessed and tend to be optimistic |
| Bottom-up | Start from the behavior of one unit and multiply up | Based on how customers or operations really work | Can miss parts of the market, and errors compound |
| Cross-check | Compare the two results | Reveals bad assumptions | Takes time to build both |
If the two land within a factor of two, you are probably in the right range. If they differ by a factor of ten, one of your assumptions is wrong, and finding which one is the real work.
Five sanity checks that catch most errors
- Units: are you mixing monthly with yearly, or thousands with millions?
- Scale: does the result per person, per store or per day look plausible?
- Ratio to a known figure: is your estimate bigger than the whole market, the whole budget or the whole headcount?
- Direction: does a change in each assumption move the result the way you expect?
- Second route: does a different decomposition give a similar order of magnitude?
Estimating workload and time saved
The same method works inside a company. To size a time-saving idea, multiply the number of tasks per year by the minutes saved per task and by the share of tasks the change applies to, then convert minutes into hours. Present the result as time capacity, not a promise of money. Whether saved hours become lower cost or more output is a separate decision for leaders.
For example: 12,000 tickets a year, 3 minutes saved on 40% of them, gives 12,000 × 3 × 0.4 = 14,400 minutes, which is 240 hours.
What to say out loud
Estimates are easier to defend when you narrate them:
- "Rough math says this is somewhere between 50,000 and 300,000 a year. The biggest swing factor is how many households are interested."
- "I used round numbers on purpose. If you disagree with one input, tell me which and I will rerun it in a minute."
- "That figure looks too large to me. By a quick estimate the whole market is smaller than that."
Common mistakes
- False precision. Reporting 117,432 when your inputs are guesses suggests accuracy you do not have.
- One method only. A single decomposition can be wrong in a way you cannot see. Build a second route.
- Hiding the assumptions. The table of assumptions is the product. The final number is just the arithmetic.
- Never testing sensitivity. Change each assumption up and down and see which one matters. Then spend your effort there.
Where this fits in structured problem solving
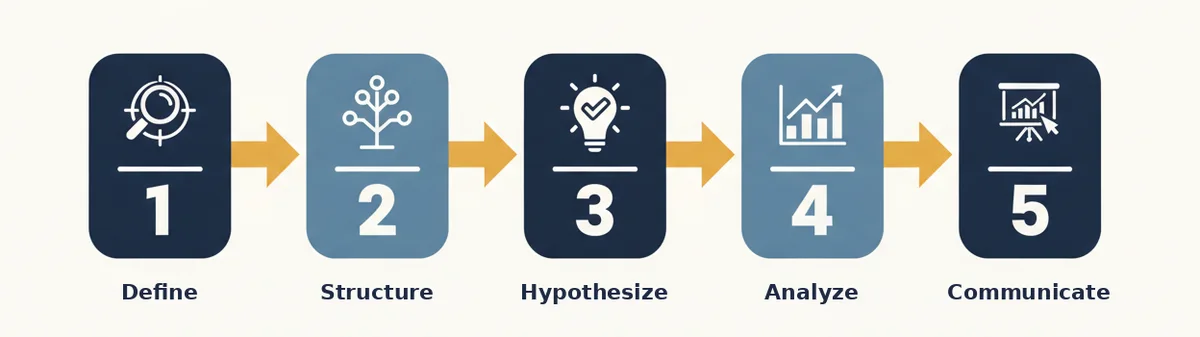
Estimates are most useful after you have framed the question. Start with a problem statement, break the question into parts with an issue tree, then use rough numbers to decide which branches deserve real data. The MECE framework helps you check that your decomposition has no overlaps or gaps.
Practice with a full method
The third guide in The Consultant's Playbook gives this topic a full chapter, along with the day-one answer, testable hypotheses, an analysis plan and the 80/20 rule. It includes a complete fictional case from first hypothesis to recommendation, and a one-page Estimate, Sensitivity and So-What Sheet you can print and fill in. The 10 Case Practice Drills in the bonuses give you more business questions to try the method on.
Educational content. It is not legal, financial or tax advice.